Merging Aggregator Platforms with Analytical Utilities for Baseball Odds Disparities Across Regions
Devon Franke · Aug 22, 2026
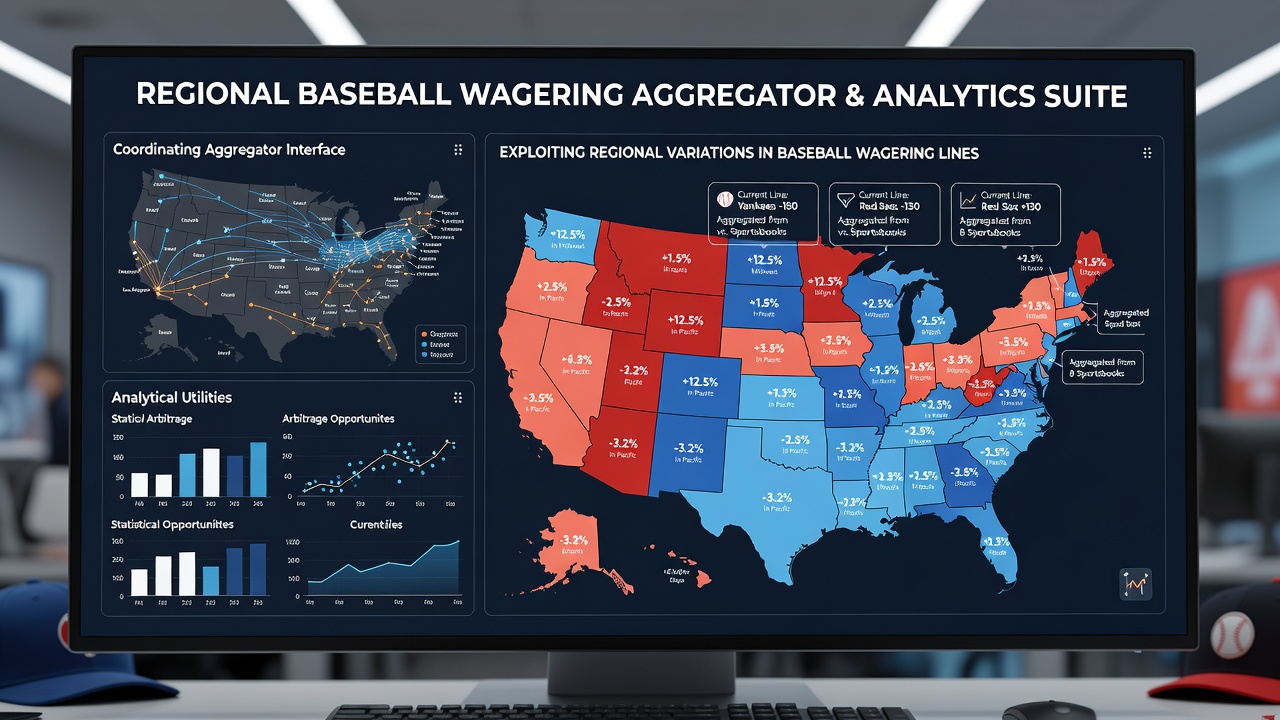
Merging Aggregator Platforms with Analytical Utilities for Baseball Odds Disparities Across Regions
Baseball wagering lines often shift based on local regulations, fan preferences, and market liquidity, and coordinating aggregator interfaces with analytical utilities allows systematic tracking of these variations without manual cross-referencing. Aggregators pull real-time odds from numerous operators while analytical utilities apply statistical models to identify spreads that exceed typical margins, and the combination creates a workflow where discrepancies become actionable data points rather than isolated observations.
Understanding Regional Line Variations in Baseball Markets
Regional factors such as state-specific tax structures, differing limits on promotional offers, and varying levels of market maturity produce measurable differences in baseball lines, particularly when comparing North American books against those operating in Europe or Asia. Data from major league games shows that run totals adn moneyline spreads can diverge by several percentage points depending on whether the operator serves a high-volume domestic audience or a more specialized international one, and these gaps widen during peak seasons when volume spikes create temporary imbalances.
Studies conducted by industry research groups have documented how weather patterns, team travel schedules, and even time-zone effects influence betting volume in specific territories, which in turn affects how books adjust their lines. Aggregators compile these adjustments across jurisdictions while analytical utilities overlay historical performance data to flag where current odds deviate from expected probability ranges, and the result is a clearer picture of where regional inefficiencies persist.
Technical Coordination Between Aggregators and Analytical Tools
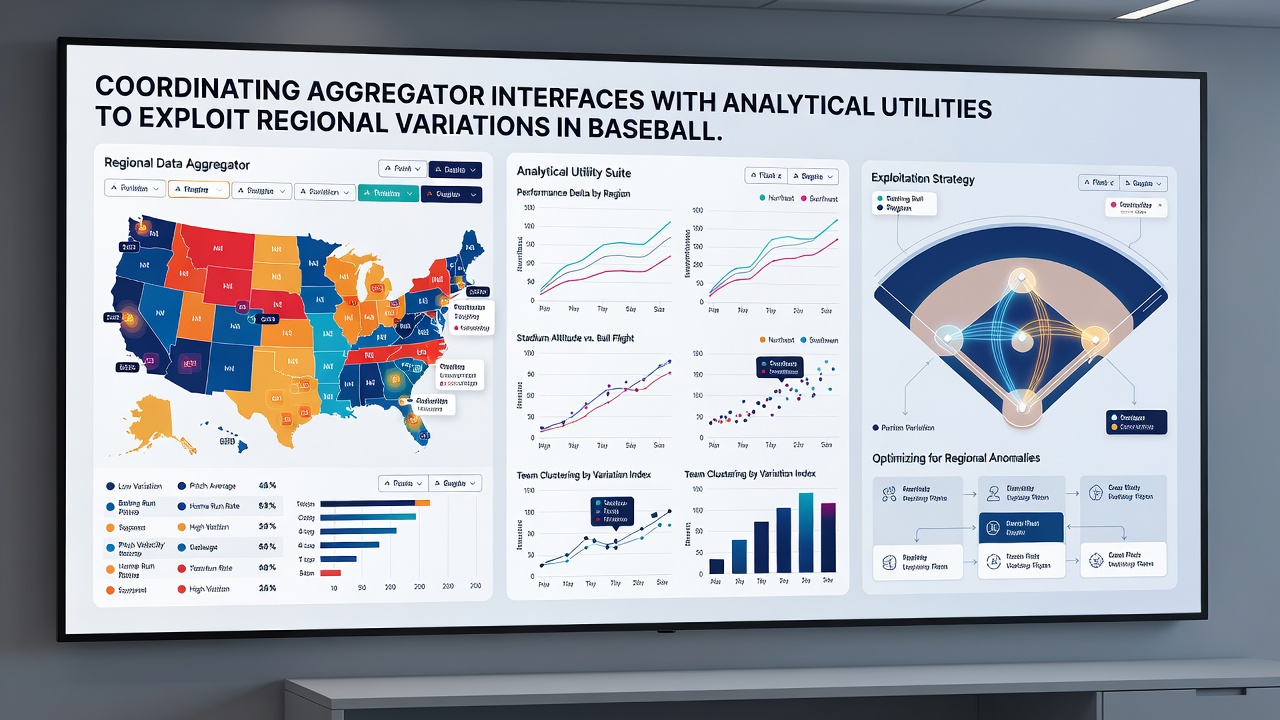
Aggregator interfaces typically expose APIs that stream odds feeds in standardized formats, allowing analytical utilities to ingest the data and apply regression models or machine-learning classifiers without custom parsing for each source. When configured correctly, these systems synchronize timestamps and normalize team names across regions, which reduces errors that arise when comparing lines from operators using different naming conventions or data formats.
Configuration often involves setting alert thresholds based on volatility metrics derived from past seasons, and utilities then monitor for instances where a line in one region moves faster than correlated markets elsewhere. In August 2026, several platforms updated their integration protocols to handle expanded minor-league coverage, which added new data streams and required recalibration of existing analytical filters to maintain accuracy across the broader baseball calendar.
Practical Implementation Steps and Data Handling
Operators and analysts begin by mapping aggregator endpoints to the utility's input layer, then establish rules that account for currency conversion and any regional hold percentages that books apply. Once live, the system logs each detected variation along with contextual metadata such as game time, roster changes, and recent line movement velocity, creating an audit trail that supports later review.
Those who maintain these setups report that combining aggregator breadth with utility depth reduces the time spent on manual verification, since the paired tools surface only the variations that meet predefined statistical criteria. External datasets from sources like the American Gaming Association provide baseline participation figures that help calibrate models for expected regional volume, while reports from Canadian gaming research organizations supply additional context on cross-border betting flows that influence line setting.
Case Examples of Coordinated Systems in Operation
One documented workflow involves feeding aggregator streams into a utility that calculates implied probabilities for both totals and sides, then compares those figures against historical closing-line values from the same region. When a line in a lower-volume market lags behind correlated books by more than the model's tolerance, the system generates a notification that includes suggested stake sizing derived from bankroll and variance parameters.
Another configuration uses sentiment analysis on local news feeds to adjust expected line movement, allowing the utility to anticipate rather than merely react to regional shifts. Observers note that these layered approaches become particularly relevant during interleague play or when international broadcasts increase overseas interest in specific matchups, because the added attention can compress or widen lines differently depending on the operator's primary customer base.
Conclusion
Coordinating aggregator interfaces with analytical utilities produces a repeatable process for identifying and monitoring regional variations in baseball wagering lines, and the approach relies on standardized data exchange, calibrated thresholds, and ongoing validation against external benchmarks. As baseball schedules evolve and new markets emerge, the same coordination principles continue to support consistent tracking across jurisdictions without requiring separate manual reviews for each territory.