Algorithmic Spotting of Mispriced Odds: Scanners and Calculators Drive Betting Decisions
Bianca Meier · Aug 10, 2026
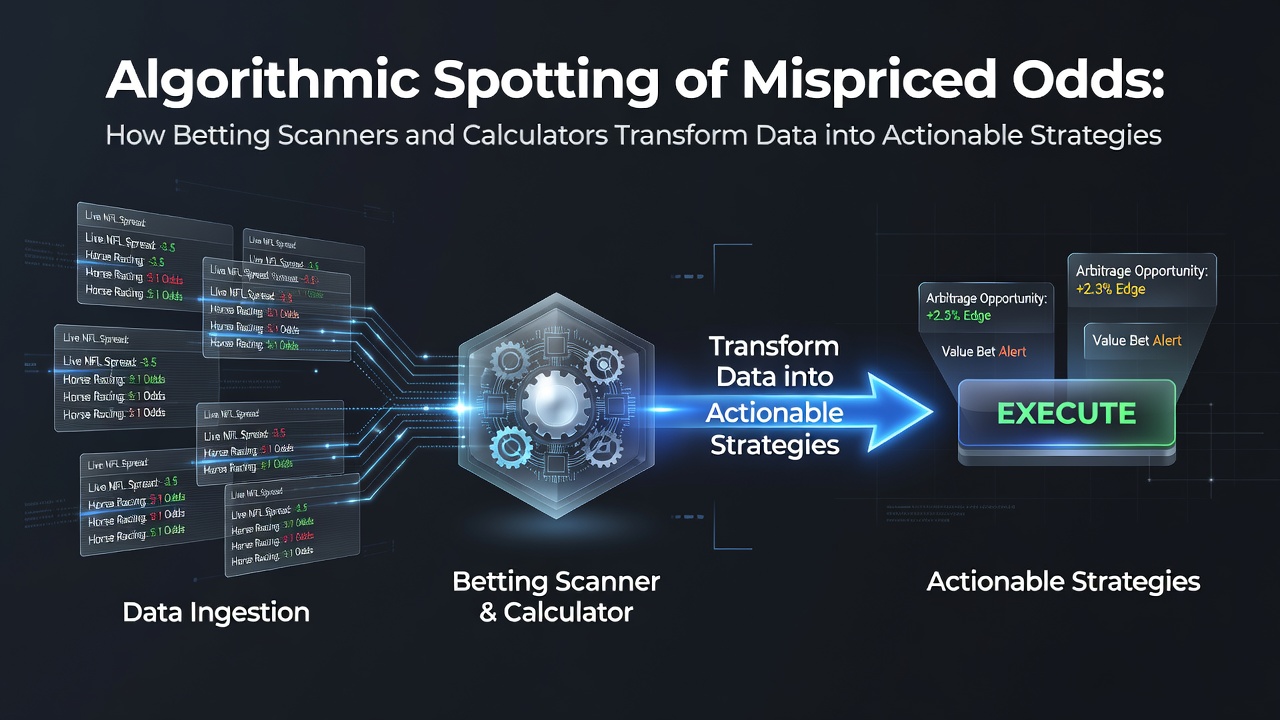
Algorithmic Spotting of Mispriced Odds: Scanners and Calculators Drive Betting Decisions
Betting markets generate vast streams of odds data from exchanges and bookmakers around the world, and algorithmic systems now parse those streams to flag discrepancies that traditional manual review often misses. Scanners pull live prices from dozens of sources simultaneously while calculators apply statistical models to convert raw numbers into expected values and implied probabilities, turning scattered inputs into clear signals for bet placement. Observers note that these tools operate continuously, refreshing outputs as new information arrives from events in progress or from pre-event adjustments by operators.
Data Aggregation and Real-Time Processing
Scanners function by establishing direct feeds or API connections to betting platforms, compiling prices for the same outcome across multiple operators in fractions of a second. When one bookmaker lists a higher probability for an event than another, the scanner records the gap and calculates the potential margin if both sides were taken simultaneously. Researchers at institutions studying market efficiency have documented how these gaps arise from differences in risk models, regional customer bases, and response times to breaking news, with systems in August 2026 incorporating faster latency reductions that allow detection windows measured in milliseconds rather than minutes.
Calculators then receive the aggregated figures and run them through formulas that account for bookmaker margins, historical outcome frequencies, and current market liquidity. The process identifies whether a quoted price exceeds or falls short of the true probability derived from combined data sets, producing a numerical edge that users can evaluate against their own bankroll constraints. Those who've examined the underlying code structures know that many calculators apply Poisson distributions for score-based sports or logistic regressions for binary outcomes, each chosen according to the sport and market type under review.
Statistical Models Behind Mispricing Detection
Algorithms employed in modern scanners rely on anomaly detection techniques that compare incoming odds against historical benchmarks and against prices offered by peer operators. When deviations exceed preset thresholds, the system generates alerts that include the size of the mispricing and the time remaining before the market is expected to correct. Studies from academic groups focused on quantitative finance have shown that such thresholds are often calibrated using machine learning models trained on years of closing-line data, allowing the software to distinguish between random fluctuations and persistent inefficiencies that persist long enough for action.
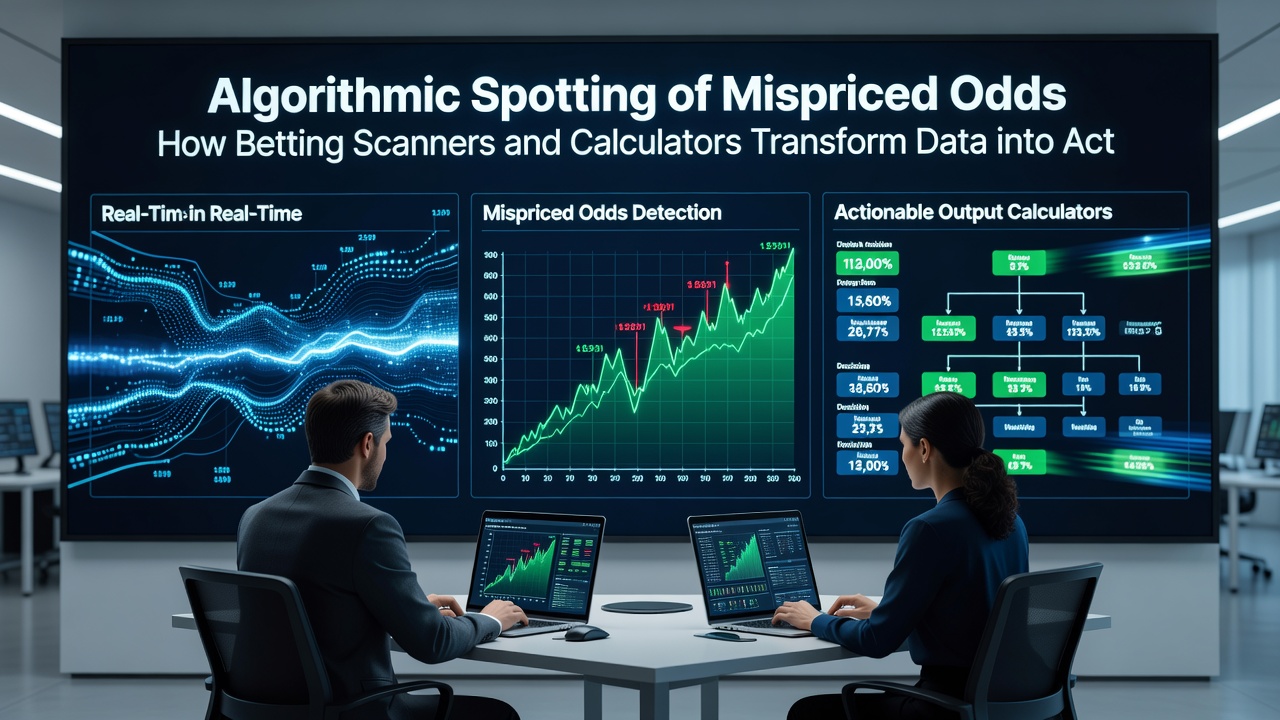
One approach involves constructing implied probability curves across related markets, such as over-under totals and individual team totals in the same match, then flagging instances where the curves fail to align within expected tolerances. Another applies clustering methods to group similar events and measure how current odds compare to the cluster average, highlighting outliers that may represent temporary mispricing. Data from these processes feed directly into calculators that output recommended stake sizes based on Kelly criterion variants or simpler fractional sizing rules, each adjusted for the user's recorded win rate history.
Integration of Scanners with Calculators for Strategy Formation
Effective use requires seamless handoff between the scanner that surfaces candidates and the calculator that quantifies their merit. Scanners typically export filtered results in standardized formats that calculators import without manual re-entry, preserving accuracy and speed. In practice this means a user can receive an alert on a tennis match line, review the calculator's expected value output, and decide on stake size before the discrepancy narrows. Reports from industry analysis groups indicate that platforms offering both functions in one interface have seen increased adoption as latency between detection and execution becomes a decisive factor.
External data sources such as weather reports for outdoor events or injury updates from team medical staff are sometimes layered into the same pipeline, with algorithms weighting their impact according to historical performance correlations. The combined output then appears as a ranked list ordered by projected return or by probability of positive outcome, allowing systematic review rather than ad-hoc selection. According to research published through the Australian Gambling Research Centre, operators that integrate multiple data layers report higher consistency in identifying repeatable edges across seasons.
Limitations and Market Responses
Even sophisticated systems encounter constraints when bookmakers adjust limits or when liquidity dries up on one side of a proposed position. Algorithms must therefore incorporate real-time volume checks and sometimes delay alerts until sufficient liquidity confirms that the quoted price remains available. In August 2026 several major platforms introduced additional verification steps that require confirmation of stake acceptance before final calculation outputs are locked, reflecting ongoing adaptation to operator countermeasures.
Another challenge arises when correlated markets move in tandem, requiring calculators to solve simultaneous equations rather than independent ones. Solutions involve matrix methods or Monte Carlo simulations that sample thousands of possible outcome combinations to arrive at a joint probability distribution. Those who maintain such systems emphasize that computational cost rises quickly with added variables, yet advances in cloud processing have kept response times acceptable for live markets.
Conclusion
Algorithmic scanners and calculators together form a pipeline that converts raw odds data into quantified opportunities by detecting mispricings through statistical comparison and then sizing positions according to probability models. The approach depends on continuous data feeds, calibrated thresholds, and integrated calculation steps that together shorten the interval between market movement and user decision. As processing speeds increase and additional data layers become standard inputs, the same core mechanics continue to underpin strategies that rely on measurable discrepancies rather than subjective assessment alone.